Moving averages are a commonly used indicator by technical traders to initiate price analysis.
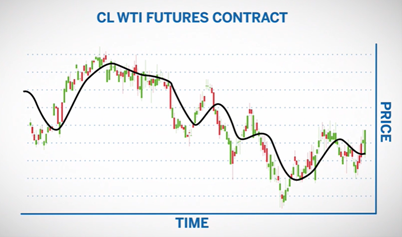
They consist of calculating the average of the prices of a financial asset over a specific period of time. Traders can use one or several moving averages on the same chart, allowing them to compare different timeframes. For example, a 14-day moving average of the CL WTI futures contract represents the average closing price of the CL contract over the last 14 days.
CALCULATING MOVING AVERAGE
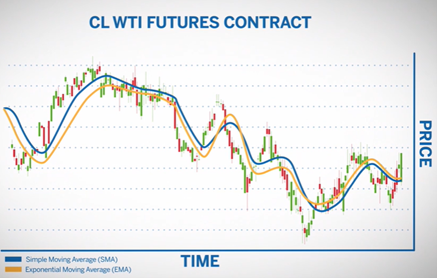
There are two common ways of calculating moving averages: simple moving averages and exponential moving averages. These tools are used in technical analysis to smooth price fluctuations and detect trends. While simple moving averages give equal weight to all data points, exponential moving averages place greater importance on more recent data. Traders can employ multiple moving averages on a chart to make trading decisions based on different trend analyses.
- Simple Moving Average
It is calculated by summing up the closing prices of the last x days and dividing by the number of days.
For example, if WTI (CL) contract closed at $45.50, $45.25 and $46.10 over the last three days the moving average would be calculated as follows:
Sum of closing prices = 45.50 + 45.25 + 46.10 = 136.85
Simple moving average = sum of closing prices divided by number of days
= 136.85 / 3
= $45.62
- Exponential Moving Averages
Exponential moving averages (EMAs) are a type of indicator used in technical analysis that assigns more weight to recent data and less to older data through a weighting multiplier. This makes them more sensitive to price changes and helps smooth out the chart line. Calculating an EMA involves determining an initial simple moving average (SMA), calculating a multiplier, and then using the current price along with the multiplier and the value of the previous EMA to obtain the new EMA value. For example, for a 14-day EMA, it can be calculated using today’s closing price and yesterday’s EMA value.
Here is the calculation for a 14-day EMA:
1. SMA = $46.60, Closing price today is $46.75
2. Multiplier = 2 / (1 + n) = 2 / ( 1 + 14) = 0.133
3. Calculate the EMA = (Price today x Multiplier) + (EMA yesterday x ( 1 – multiplier)
EMA = (46.75 x 0.133) + (46.60 x 0.867)
EMA = $46.63
It is not necessary to perform these calculations manually, as moving average indicators automate this process and display the results on the chart. Although there are other types of more complicated moving averages, such as those that use different weights and smoothing variables, EMAs and SMAs are the most common.
USING MOVING AVERAGES
How can traders use moving averages on their charts?
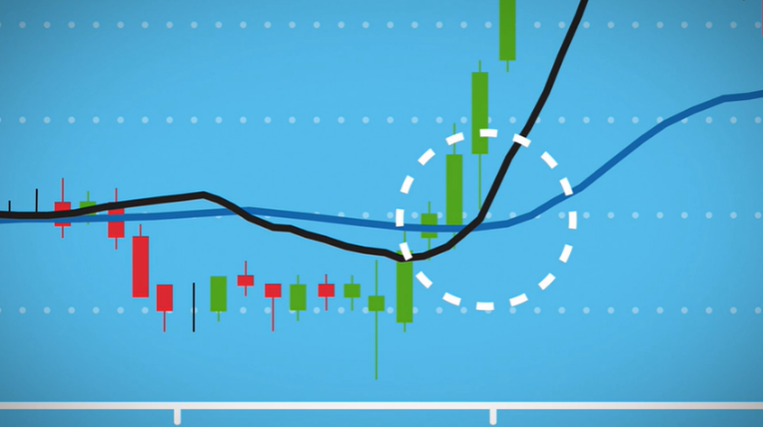
Inform decisions about: trade entries, compare current price to support and resistance, new direction and retracements.
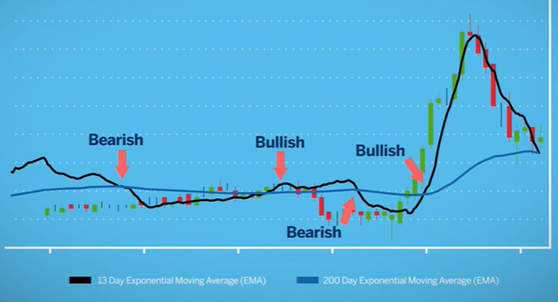
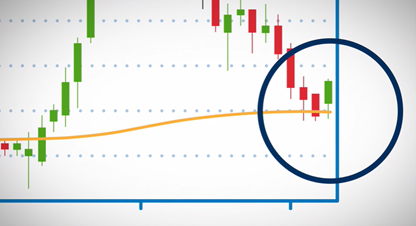
Moving averages are tools used by traders to analyze the position of price in relation to support and resistance on a chart. When the price approaches a moving average, it can indicate a possible point of halt or reversal. Different time periods can be used to visualize short-term and long-term support and resistance. Moving average crossovers, where one line crosses another, can indicate changes in the price direction. A short-term moving average crossing above a long-term moving average is considered bullish, while the opposite is considered bearish. Moving averages are simple yet powerful tools to help predict the future direction of price in trading.