
Technical analysts look for patterns in financial markets to predict whether a trend will continue or change direction. It is mentioned that markets never move in one direction permanently, so analysts look for signals of trend change. Patterns such as triangles, rectangles, pennants, and flags are highlighted as indicators of continuation of movements on price charts.
TRIANGLES
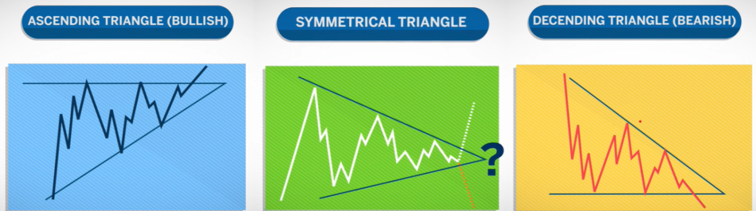
How to identify and analyze triangle patterns in price charts. It explains that triangles form when the price range narrows, indicating a pause in market activity. Three main types of triangles are mentioned: ascending (bullish), symmetrical (can be bullish or bearish), and descending (bearish). These patterns to anticipate potential price break outs, with the shape of the triangle indicating the possible direction of the break out.
RECTANGLES
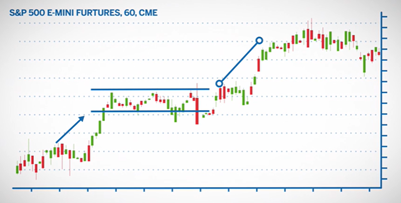
Rectangles form in the market when price moves within a narrow range with consistent highs and lows, indicating consolidation. Typically, price tends to break out of the consolidation in the same direction it entered. These rectangles are akin to channel-like formations associated with consolidation. During consolidation, neither buyers nor sellers can push the price beyond a certain range. This pattern can persist for an extended period, with no specific rule dictating its maximum duration.
FLAGS
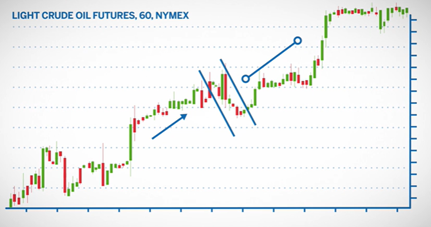
Flags are formed during a temporary retracement in price within a narrow parallel range, resembling the shape of a flag. They indicate a period of price consolidation. When the price breaks out of this consolidation, it typically resumes its original trend, often moving higher. These patterns are commonly observed during a trend but not typically at market tops or bottoms.
PENNANTS
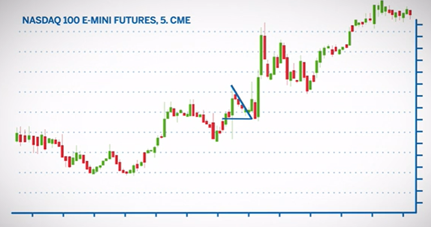
Pennants are small triangle formations and work in the same way. Since these are smaller retracements that do not take as long to form, they are typically seen mid-trend.
Traders will use these patterns when stocks retrace or consolidate to indicate if the breakout will be a continuation of the original trend. The patterns will not always signal continuation but traders can use the patterns with other evidence they have collected to help indicate where price might move next.