
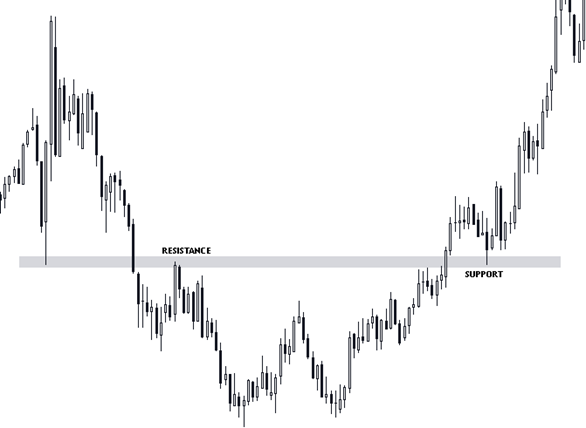
Support refers to levels where price might reverse and move higher or a level that slows the momentum of price moving down. Resistance refers to levels where price might reverse and move lower or a level that slows the momentum of price moving up. Technical analysts believe that price has a memory and that trends will repeat. Markets will tend to react at previous highs and lows levels.
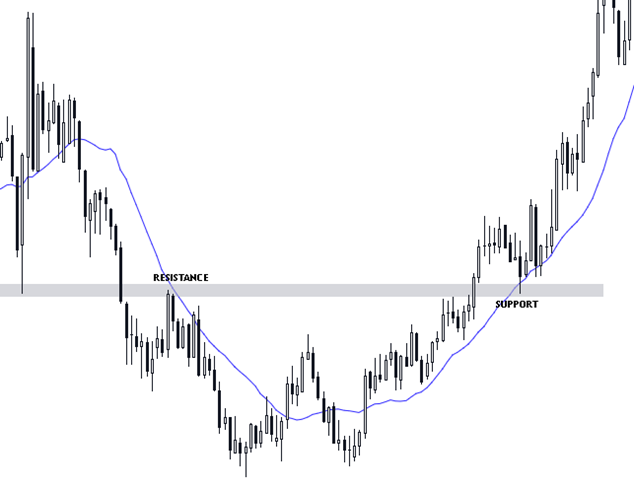
Moving averages, previous highs and lows, key price levels, and trend lines are the main indicators that traders use to find levels of support and resistance. Moving averages below price will form levels of support and moving averages above price will create levels of resistance.
Moving Average 18 periods DXY weekly chart example:
Traders might use the 100-period moving average on a daily chart to indicate stronger and longer term levels of support and resistance.
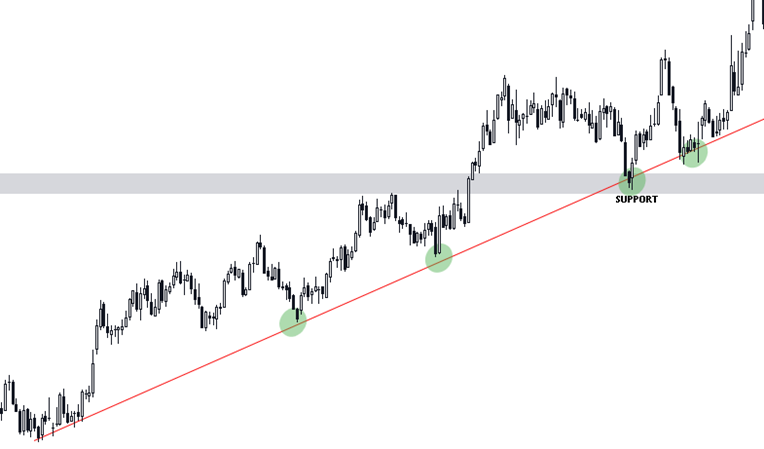
Trend lines act like moving averages, except they are based on the highs and lows that price makes.
(CME, 2023, SUPPORT AND RESISTANCE, https://www.cmegroup.com/education/courses/technical-analysis/support-and-resistance.html )