
For traders, the important feature to note is that the ratio between numbers is close to 1:1.61, the Golden Ratio. Another common ratio for retracements is 50%, this is not a number from the Fibonacci series of numbers but is the equilibrium price.
Traders use Fibonacci analysis to predict how far a stock might retrace a given move. By looking at the prior highs and lows of the previous move, traders use Fibonacci retracements to determine how far a current retracement in the stock might last. Fibonacci ratios can also be used by traders to chart the potential extension of breakouts or Price expansions. These levels can help traders determine potential zones for the current breakout to end and change direction, or a zone for price to have a small pull back.
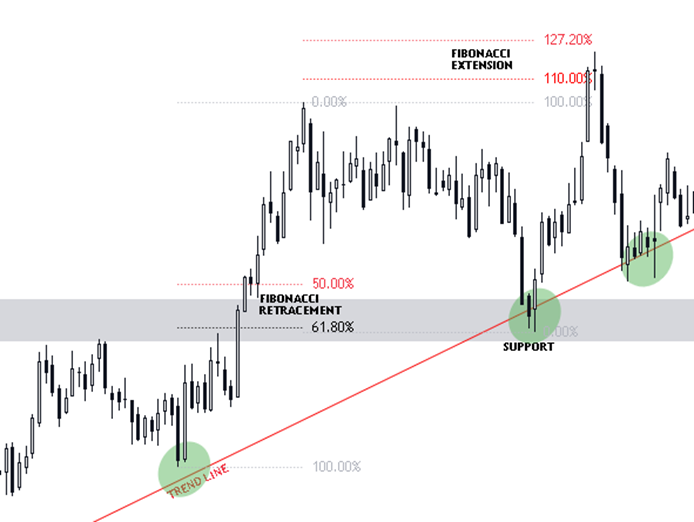
(CME, 2023, FIBONACCI RETRACEMENTS AND EXTENSIONS, https://www.cmegroup.com/education/courses/technical-analysis/fibonacci-retracements-and-extensions.html )