International Equities:
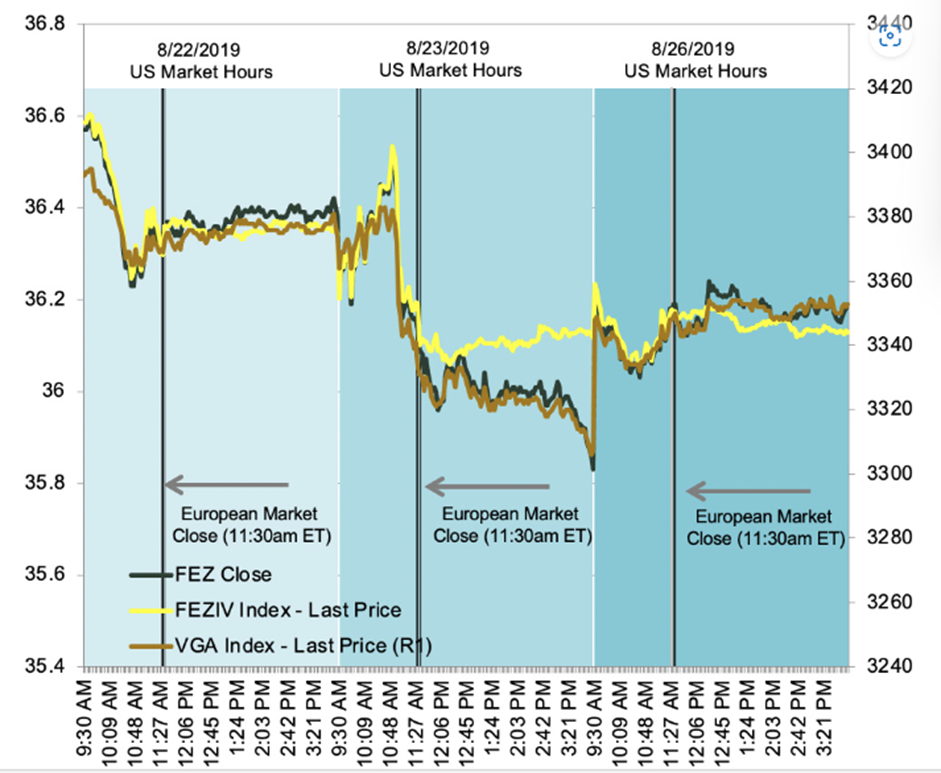
Asynchronous Trading Hours.
- The ETF’s iNAV typically reflects the local market closing prices of the underlying components adjusted for currency impact.
- When the underlying stock markets are closed, the ETF price may deviate from the ETF’s iNAV calculation as investors react to new information.
- Hedging instrument availability: The Euro Stoxx 50 futures contract is a better reference vehicle than the iNAV ETF when Europe is closed.
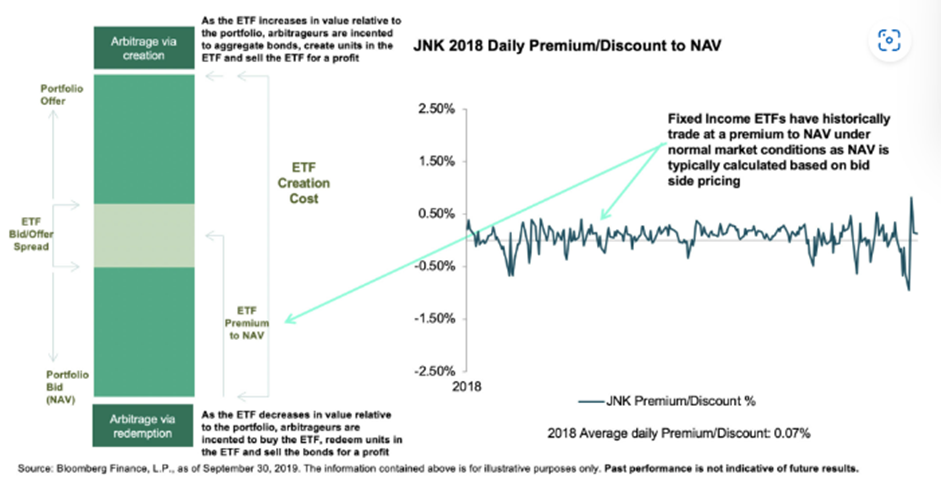
Fixed Income ETFs: Premium/Discount
Premium or Discount: The price of the ETF relative to the net asset value (NAV) of the underlying basket can be a catalyst for the creation/redemption process
Premiums or Discounts: These differences may also represent periods of price discovery, as continuous ETF pricing provides transparency to outdated underlying prices or differences in market structure (i.e., close at 3 p.m. vs. 4 p.m.)
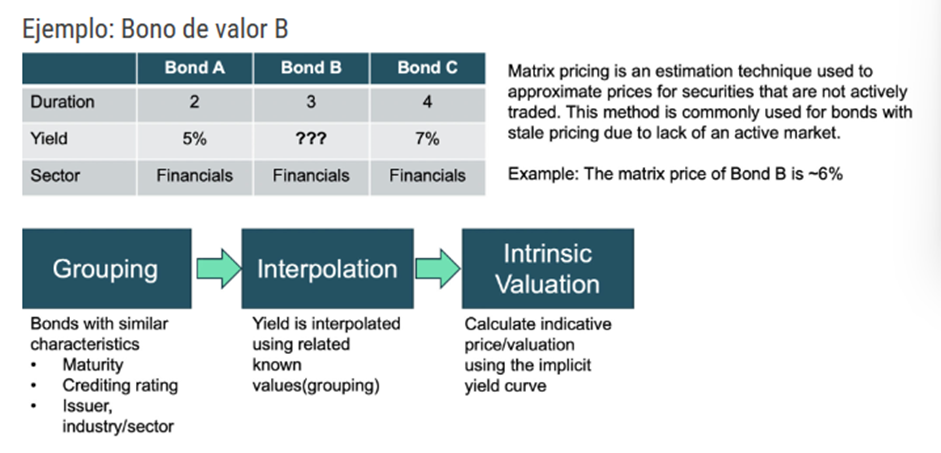
Renta fija ETFs: Matrix Pricing
When quotes are not available, matrix pricing is a commonly used method of pricing a bond.
Fixed Income ETFs: Benefits of Wrapper
As single-bond trading has become more restricted, the alternative route of obtaining bond liquidity through ETF trading has grown.
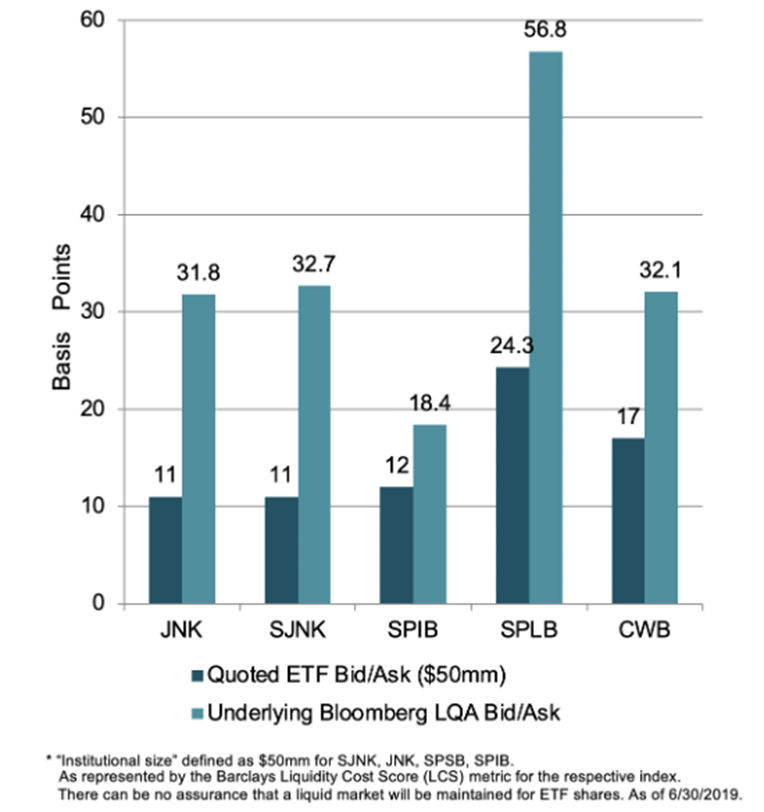
Transaction cost savings: The bid-ask spreads for institutional-sized ETF trades have historically been significantly lower than the stated spreads for the underlying fixed income securities*
Centralized liquidity: Trading ETFs on exchanges provides a consolidated place of observable liquidity.
Effectiveness: The ETF provides deployment flexibility with easier trading relative to buying individual bonds in the OTC market.
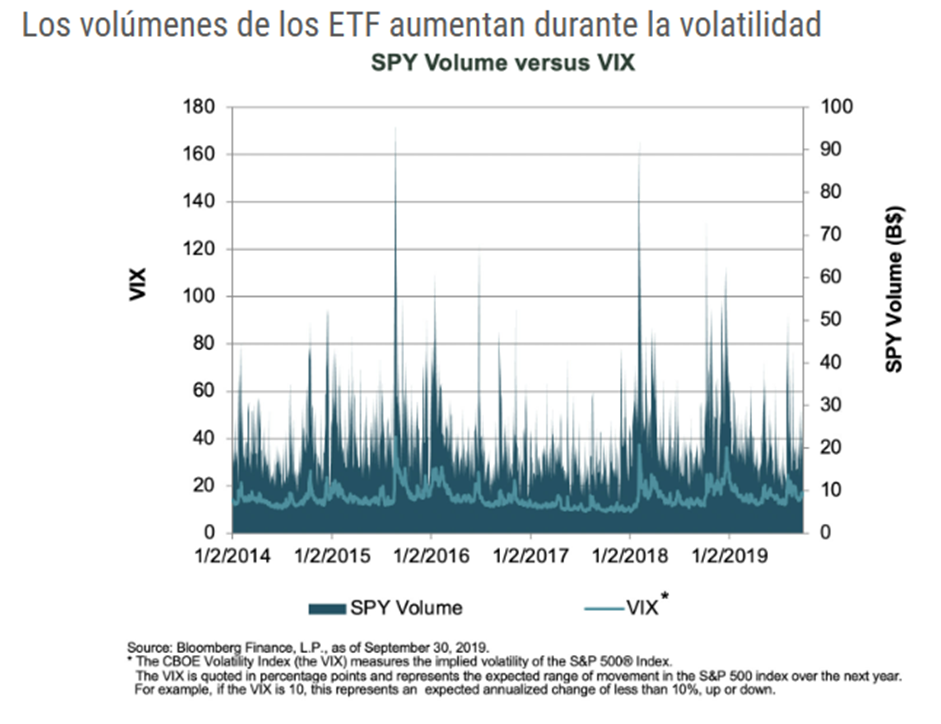
ETFs y eventos de volatilidad del mercado
HY ETF Trading Behavior
- Premium & Discount
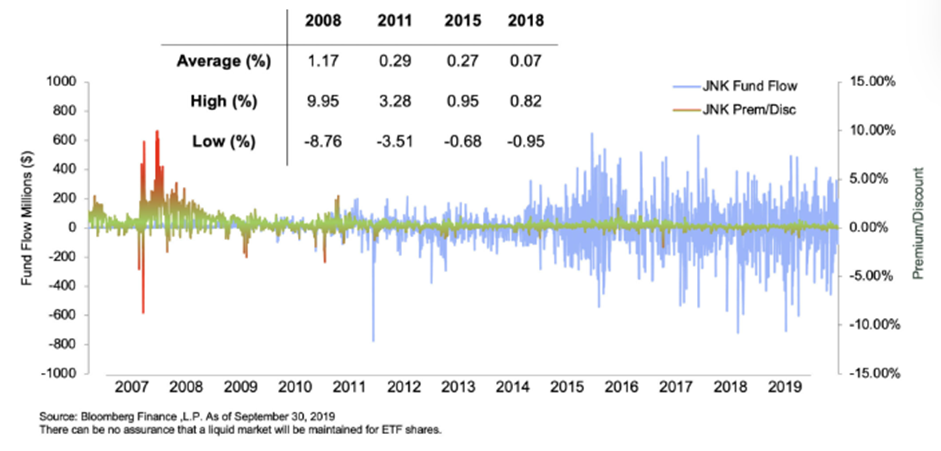
- Trading high-yield ETFs
- During periods of high volatility, high-yield ETF primary market activity is only a small percentage of total high-yield spot bond trading
- High-yield ETFs have become a remarkable trading tool
- Secondary market volume adds to the liquidity profile of the overall high yield market.
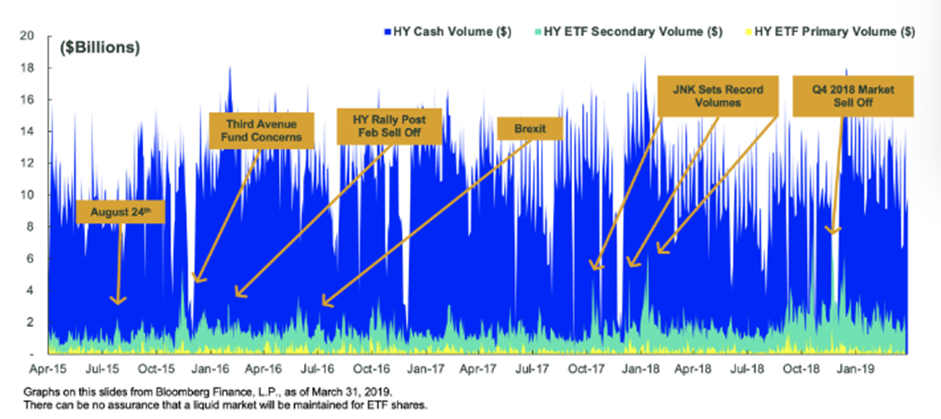
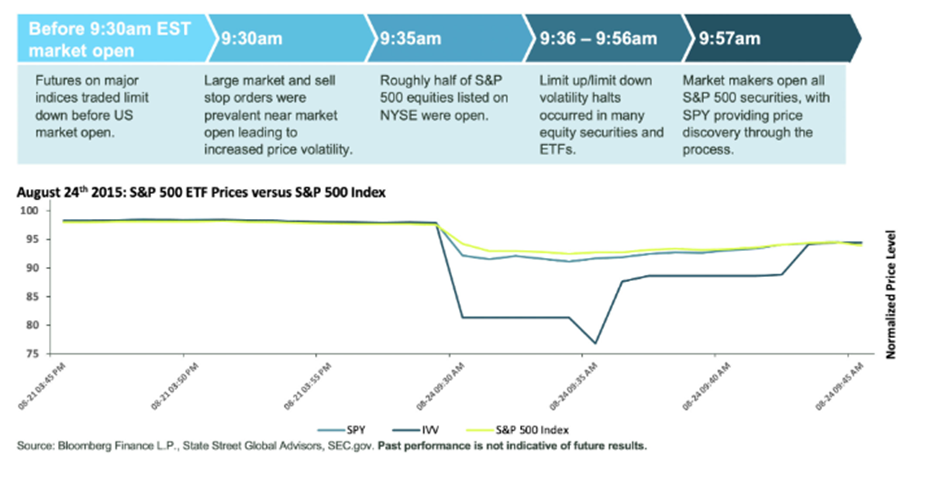
Case Study: August 24, 2015
What happened
Concerns about global growth led to a sharp sell-off in emerging markets and spilled over into U.S. markets. This resulted in pre-market volatility, an atypical market opening process, and SPY’s largest domestic trading session.
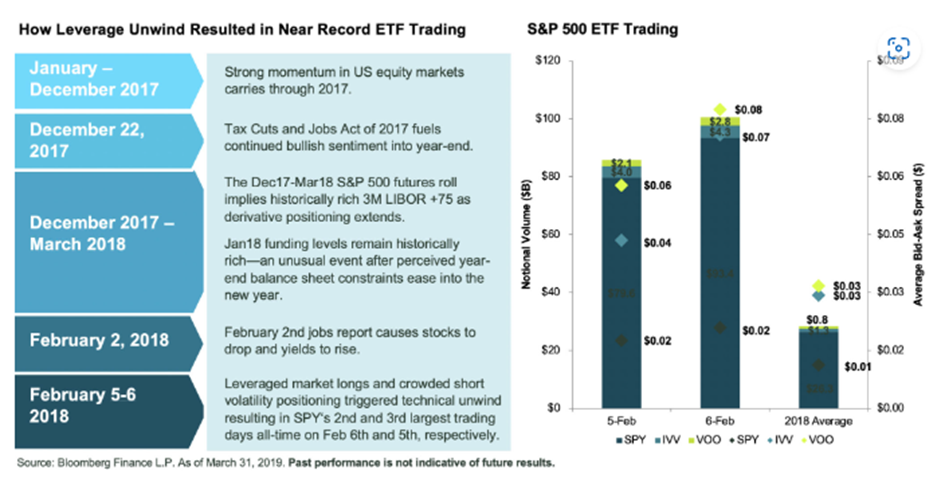
Case Study: February 2018
What happened
A technically driven reversal of the historically long position of S&P 500 derivatives contributed to stock market volatility on Feb. 5 and 6, resulting in the second- and third-largest domestic trading sessions in history.
Case Study: Q4 2018
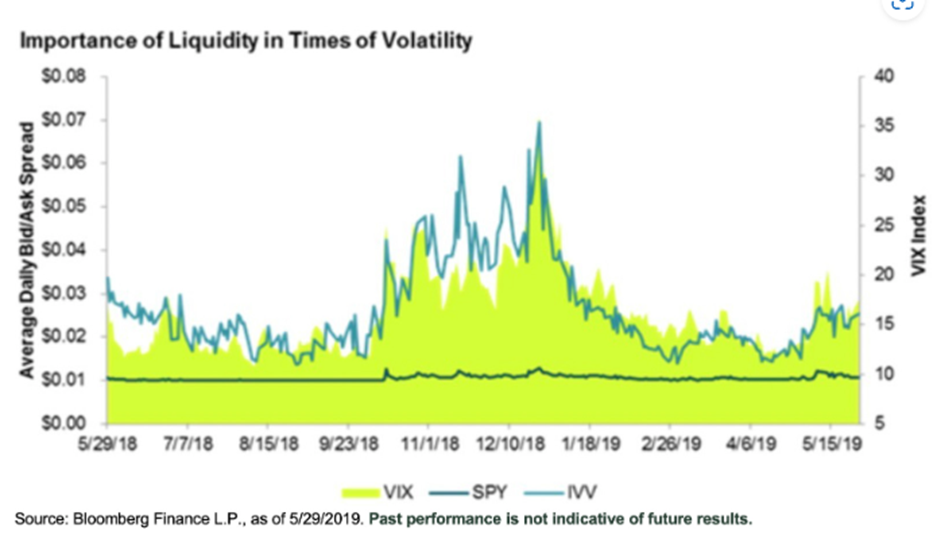
SPY maintains consistent spreads during the market sell-off.
What happened
Market volatility spiked in the fourth quarter of 2018 as concerns about slowing global growth, tightening monetary policy, and escalating trade wars led to a sharp sell-off in the market, during this time period, SPY spreads remained at constant levels.
An ETF liquidity comparison: In the fourth quarter of 2018, the iShares Core S&P 500 ETF (IVV) saw spreads widen with increased volatility, while SPY maintained consistent spreads, allowing investors to pivot in either direction with the same trading costs.