
In the monitor panel investors can find Watchlists and the system-generated Portfolio page. Also the P&L, liquidity and margin requirements can be found at the top of the page.
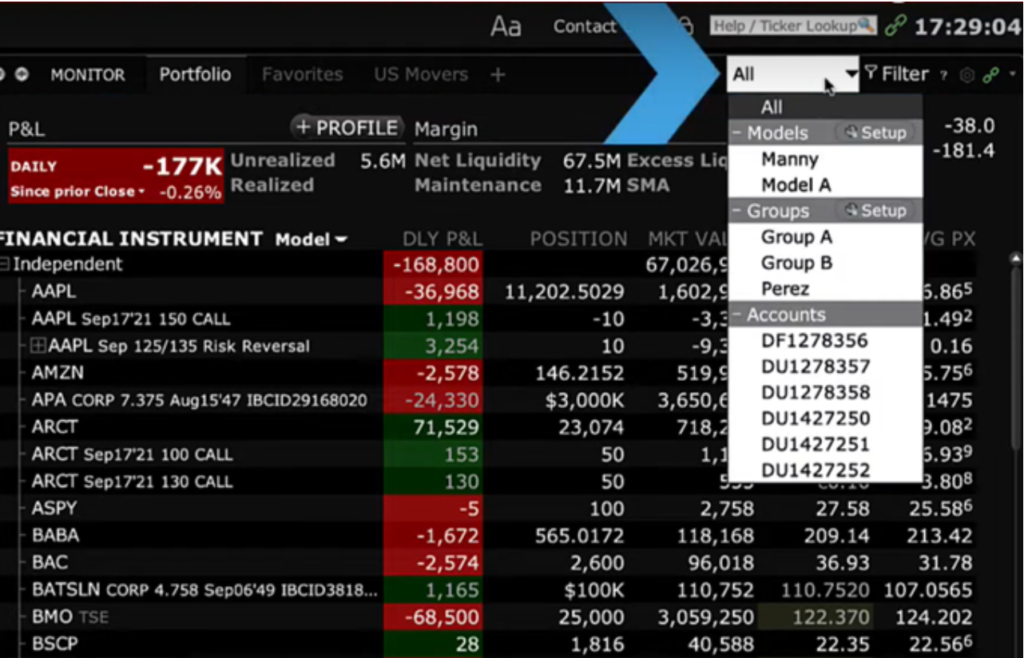
From the dropdown menu, Account Picker allows the user to select a single account, a group, or a Model Portfolio. Columns can be customized according to the user preference to show the instruments, long, short, industry and sector by right-clicking on any column header.
To close a position, select the account, group or all by right clicking the symbol as shown below:
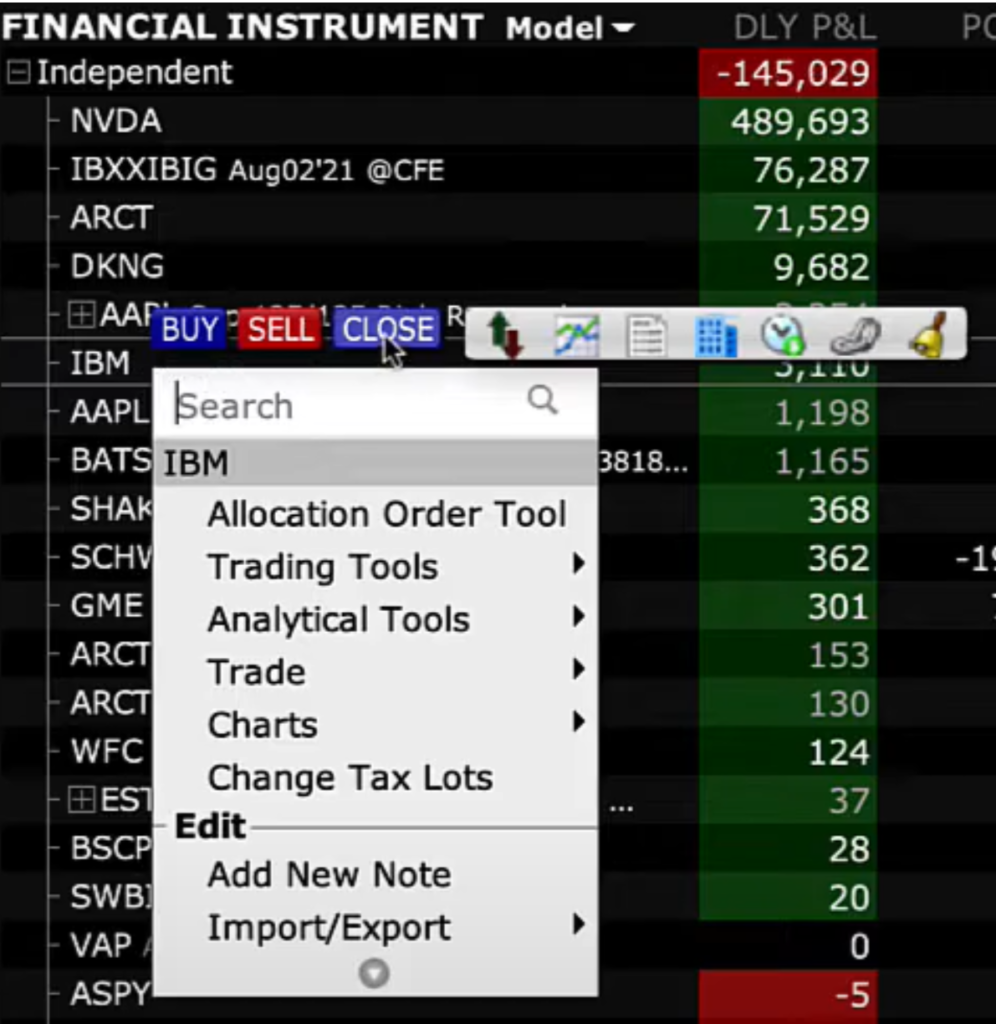
In the Order Entry panel, the background turns red to indicate the sale of a position, and the quantity field automatically matches the position size. You can modify the order type and price as needed before clicking submit to generate an order confirmation page. Once you are ready, click Transmit to finalize the order.
In the Portfolio tab, the top right features an Account button, which provides quick access to the Account Window. Alternatively, you can access it from the Account menu in the upper left corner, where you can also log in to the Account Management home area, also known as the Advisor Portal.
When you click on the Account button in the Portfolio tab, you will see two tabs: one for Account and one for a Summary view. At the top left, there is an Account Picker dropdown menu, which allows you to select a single account, a group of accounts, or accounts invested in a specific model.
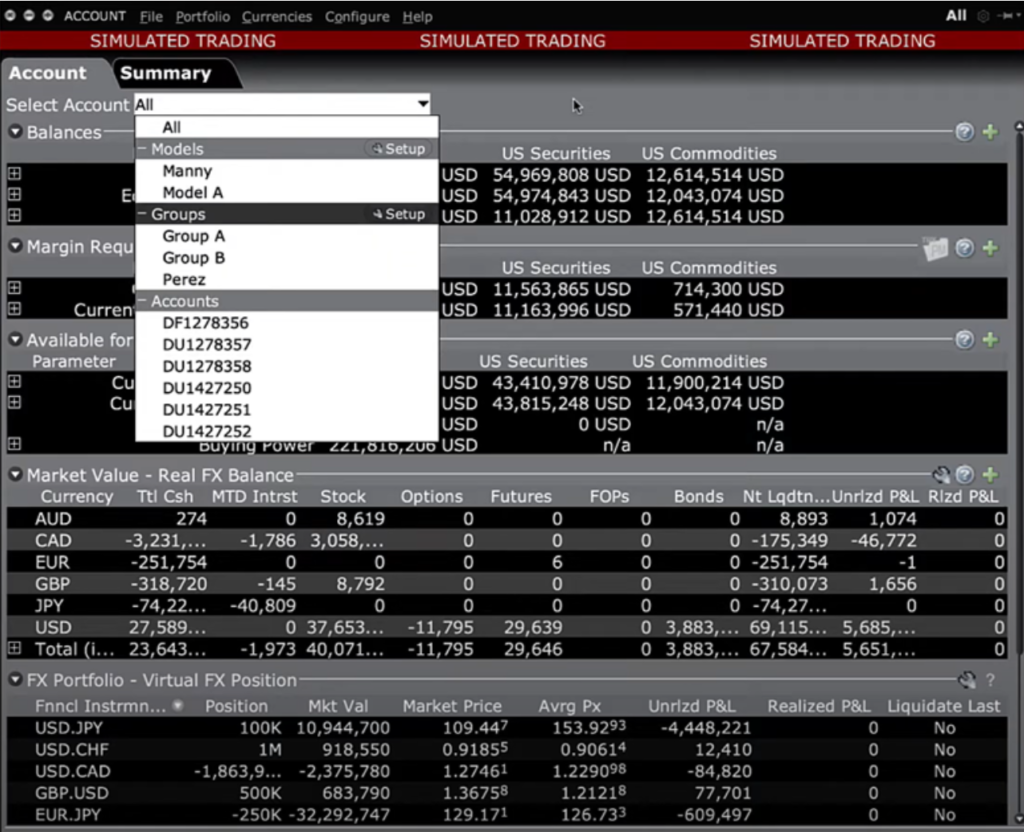
On the Account tab, there are six data views available, each with an expandable arrow on the left. These views include Balances, Margin Requirements, Funds Available for Trading, Real and Virtual FX positions, and the Portfolio view.
The Summary tab provides a comprehensive overview of account balances and market values. At the top, it displays the balances for each account, along with their respective account numbers and types. The balances area features two columns for Net Liquidation Value (NLV) – one for Stocks and another for Commodities, with their sum shown in the Net Liquidation Value column. Each account’s Buying Power is presented and is determined by the account type. The far-right column shows the combined percentage of Excess Liquidity for both Stocks and Commodities accounts.
In the Market Value area below, the tab displays cash positions and the real-time value of open positions across various asset classes, along with the unrealized profit and loss (P&L) for each account. Additionally, the Portfolio tab offers numerous customizable fields and information to simplify an Advisor’s tasks. Advisors are reminded to use the shortcut button to the Account window for quick access to clients’ buying power and available balances.