
Oscillators are a group of technical indicators that attempt to indicate the strength of a trend and if a market is over-bought or over-sold.
Oscilators can lead to two issues. First, the indicator can remain at over-bought or over-sold for a long period of time if the trend is strong. This means reversal signals can be shown for a long time before the market begins to reverse. The second issue is because the indicators are always a step behind what the market is doing, this is known as a lagging indicator.
- Moving Average Convergence Divergence (MACD): This indicator attempts to gauge the strength of a tren, the MACD shows the direction of the momentum of the trend.
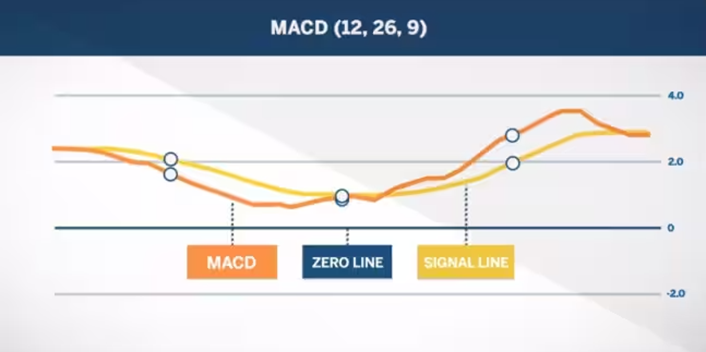
Signals are generated when the MACD line crosses the signal line. If the MACD moves below the signal line, this is generally an indication of a down move; if the MACD moves above the signal line, it is typically seen as an indication of a potential up move. Another signal that traders look for is a divergence from price. The MACD line should move up and down with the trend of price and if it starts to diverge, that might indicate a change in the trend of price.
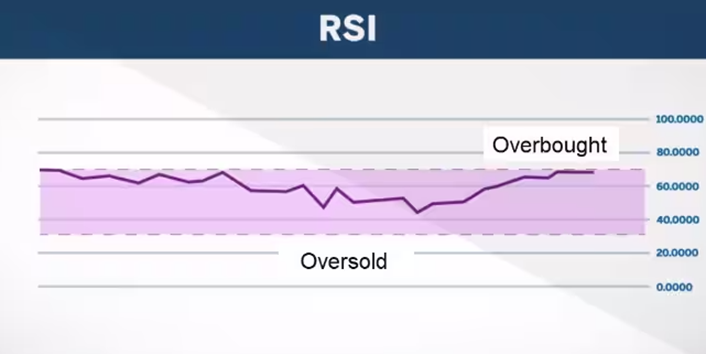
- Relative Strength Index: If the RSI is over 70, this is generally seen as over-bought and price might move down. A reading of 30 indicates a market that is over-sold and price might move up.
- Stochastics: a reading over 80 is considered over-bought and a reading below 20 is considered over-sold. This means the stock is trading either near the top of its range or near the bottom of its range.
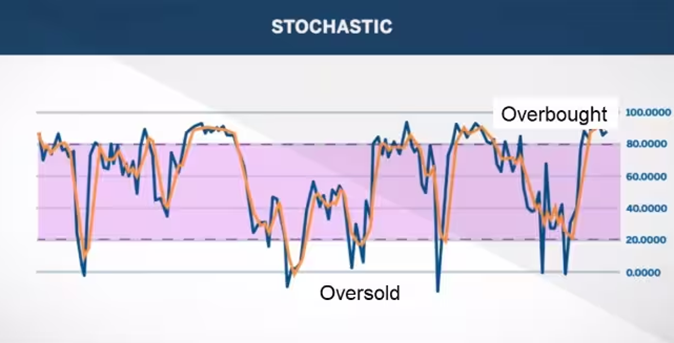
Divergences can also be signals of reversals in a market’s price. For example, if a market makes new, lower lows but the Stochastics indicator makes a series of higher lows, this might indicate a bottom is forming in the market.
(CME, 2023, OSCILLATORS: MACD, RSI, STOCHASTICS, https://www.cmegroup.com/education/courses/technical-analysis/oscillators-macd-rsi-stochastics.html)